
Capital Allocation & Valuation6 min read
ogle’s New TPUs Face a Hurdle: How Much Must Customers Save to Leave GPUs?
For Alphabet shareholders, the value of TPUs depends on what customers save, how quickly they recover migration costs and how much of the savings Google keeps.
gle splits inference into two jobs
On November 9, Google announced two additions to its eighth-generation TPU family. TPU 8tx targets confidential inference with hardware-level protections. TPU 8i Max targets workloads with very long context. Google said its broader TPU business had nearly 100 customers across products and use cases. That figure is not an order count for the two systems. Valuation hinges on whether those jobs are large enough for customers to change how they deploy. Google product announcement · The Information
A recent LatePost analysis questioned whether the hardware margins of the last few years could persist. TPUs offer a concrete test. Moving a large, repeatable workload to lower-cost custom silicon can alter a cloud provider’s GPU purchases. Jobs that require flexibility, burst capacity or wider software support may stay on GPUs. Customers can move part of their work, so the first sign may be a different mix of new purchases. LatePost
pare cost per successful task
Hardware specs and hourly rates are useful screening tools. The relevant test holds the task, quality bar and latency limit constant. Divide the cost of all attempts by the number of tasks delivered successfully. Retries, manual intervention and calls to other systems cost money. Include any extra post-processing required to deliver the same output. A common denominator turns a benchmark into an annual savings estimate.
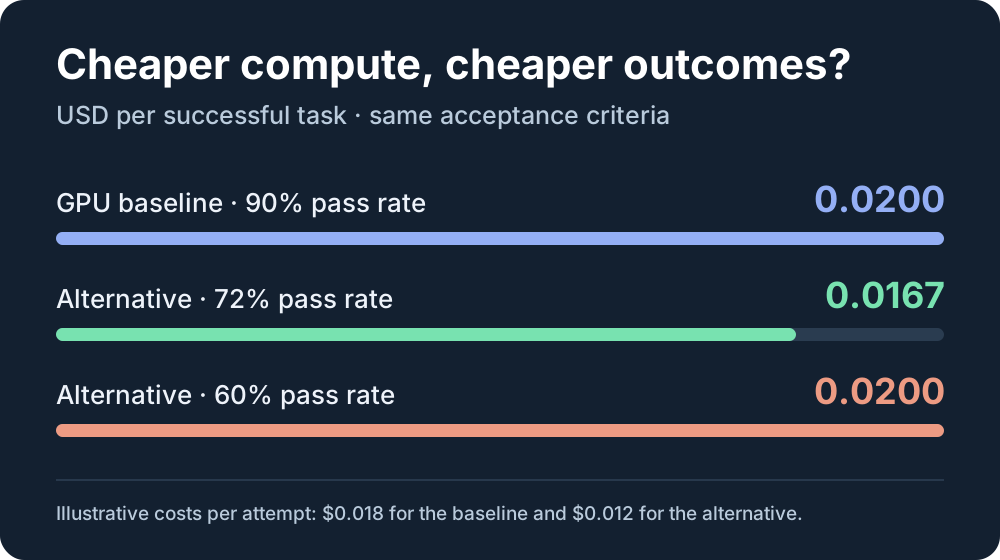
In an illustration, the GPU path costs $0.018 per attempt and passes acceptance 90% of the time, or $0.020 per successful task. Another path costs $0.012 per attempt and passes 72%, or about $0.0167 per successful task. If its pass rate falls to 60%, its unit cost returns to $0.020. These are illustrative inputs, not measured Google or NVIDIA performance.
Suppose rewriting, validation, parallel operation and training cost $240,000. At about $0.00333 saved per successful task, the buyer needs roughly 72 million completed tasks to recoup the expense before discounting. At 30 million a year, simple payback is about 2.4 years. Incremental support costs or another port after a model update extend it. Volume matters to migration economics.
Migration costs can move. Google highlighted native PyTorch support and TPU backends for common inference engines, intended to reduce rewrites. Getting the code to run is only the first step. Buyers still need to test peak queues, failure recovery, output consistency and fallback capacity. Budget validation and dual running instead of treating installation as a completed migration. Google announcement
A low-volume team can frame the question more directly. At 30 million successful tasks a year, one-year recovery of $240,000 requires $0.008 saved per task, more than in the illustration. If usage is growing fast, a buyer can migrate one stable workload to validate costs and expand later. Keeping GPU fallback can cost money while limiting the impact of a failed switch.
much of the savings can Google keep?
Google can win customers with a lower price and pass the savings through. Or it can bundle specialized systems into a service and earn a higher contract price for delivery performance. The first path may still improve cash flow if it produces sustained volume and better utilization. The second needs a problem the customer values and rivals cannot readily solve another way. Both have to cover chip development, facilities, power and replacement equipment.
Google Cloud reported $30.7 billion of third-quarter revenue, up 103% year over year. That covers the entire cloud business and does not isolate TPU revenue or margins. Separate external revenue, savings on internal workloads and foregone external income when capacity is kept in-house. The same machine cannot earn both full returns at once. Alphabet results
Damodaran’s reinvestment lens helps. Cheaper equipment may require faster expansion to serve growth or lower prices to win work, so returns can improve less than gross margin suggests. If the same stack serves several customers whose workloads peak at different times, higher utilization spreads fixed costs further. Track price, usage and the capital needed for each increment of capacity together.
dence that would lift long-run profit
Watch production renewals and capacity deployments beyond launch announcements. Look for comparable cost data with the task, quality, latency and scale specified. Check whether the advantage lasts across billing periods. Then reconcile cloud profit with capex. If customers expand while operating margin stalls, distinguish pricing concessions, depreciation and new capacity that has yet to earn revenue.
Distinguish commitments from machine use. A customer can reserve more capacity without immediately consuming it. Returns depend on installation dates, the ramp to steady utilization and whether power and depreciation start before revenue. If a big customer’s use clusters in short bursts and average utilization disappoints, the unit advantage narrows. That can matter more to reported cloud profit than a launch benchmark.
Read our analysis of NVIDIA’s GPU moat
Model two cases in Valuefocus. In one, customers retain most of the savings. In the other, Google achieves better utilization and keeps more of the economics. Include the necessary capital spending in both and compare long-term cash flows. Slow migration or heavy pass-through makes a launch alone a weak reason to raise terminal value. Build a DCF in Valuefocus
Sources and photo credits
Recent posts















































Test the cash-flow assumptions from the article in Valuefocus.
Open DCF Calculator