
Electric Vehicles, Manufacturing and Capital Returns7 min read
Leapmotor’s 18 Factories: A Cost Moat, or a Treadmill That Cannot Slow?
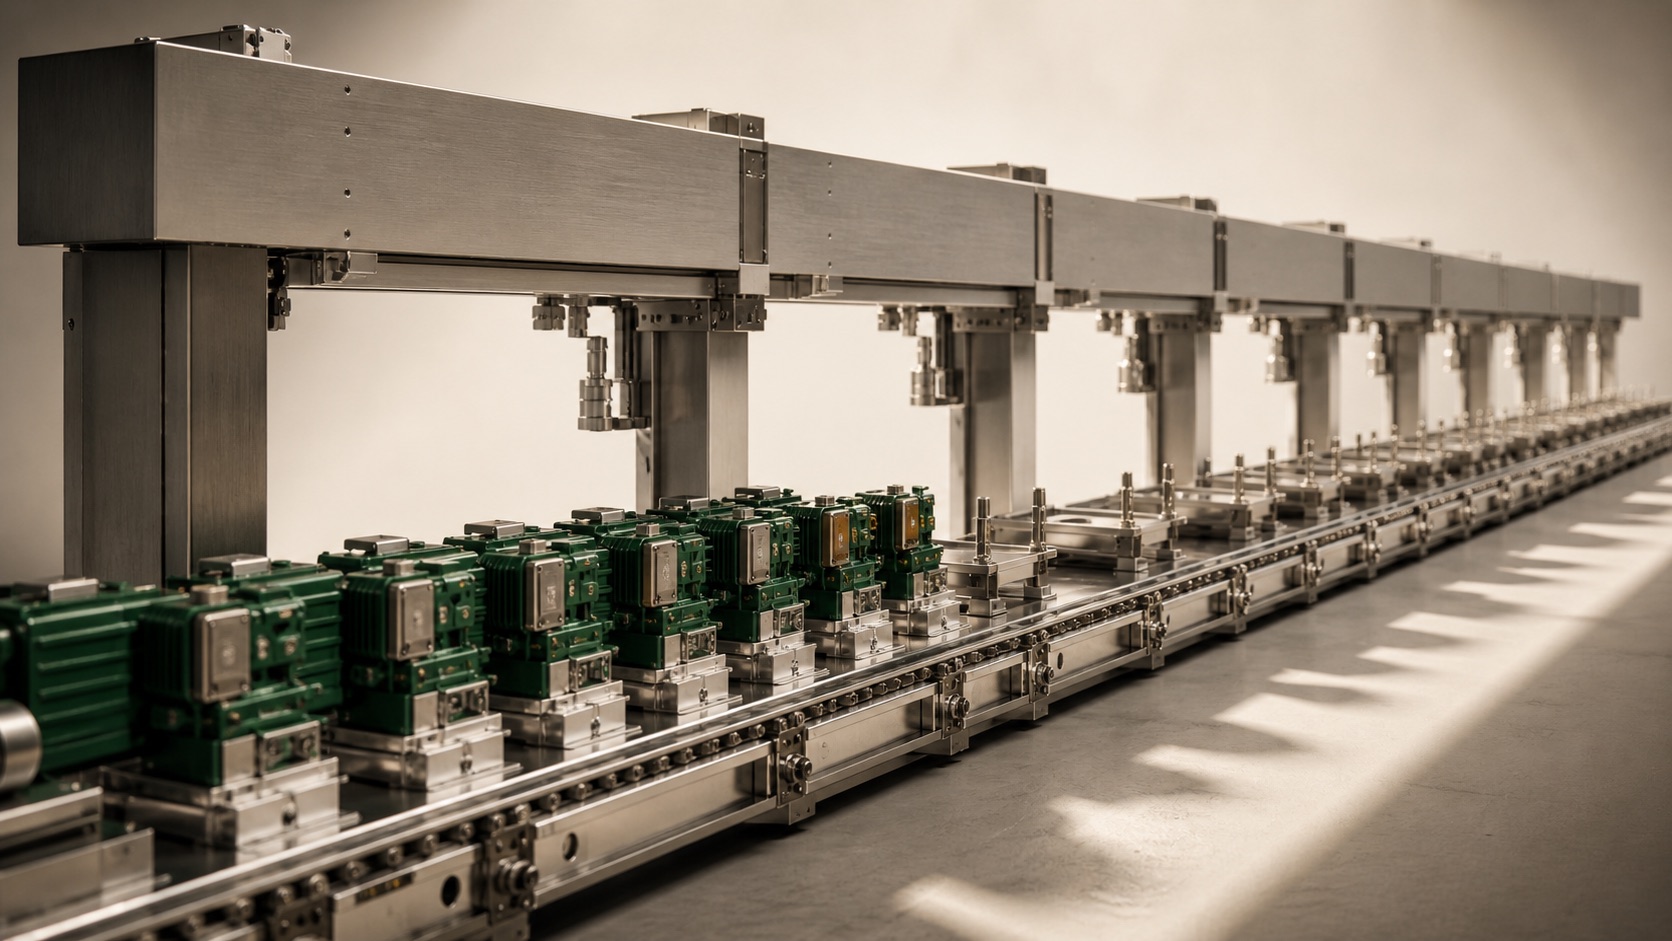
After July deliveries surpassed 100,000, Leapmotor looked like it had crossed a scale threshold. Another scorecard deserves attention: roughly RMB210 million in net profit on RMB38.1 billion of first-half revenue. Making components internally removes some supplier markup, but brings more fixed costs inside. The test is whether those factories still earn money when their lines are less full.

An upbeat factory story meets a 0.55% net margin
LatePost’s August 26 report connected three profitable half-years with Leapmotor’s 18 component factories. There is a plausible mechanism: closer feedback between design, engineering and production can reduce coordination delays and improve cost and quality.
The August 24 HKEX filing reports H1 revenue of RMB38.107 billion and attributable net profit of RMB208.411 million, a net margin of about 0.55%. Deliveries reached 356,487, up 60.8%, while revenue grew 57.2%. Profitability is progress, but not synonymous with a substantial cushion. Dividing group profit by deliveries does not reveal the actual contribution margin of each vehicle.
Insourcing the work also insources the quiet months
An automaker buying components pays the supplier’s costs and profit. It also leaves some equipment, staffing and capacity risks with that supplier. Bringing production inside does not capture the markup for free: facilities, engineering, yield improvement and equipment renewal become the automaker’s responsibility.
The relevant comparison is not an internal quotation against an outside price. It is through-cycle total cost after depreciation, capital employed, quality and warranty obligations. A 65% in-house rate does not mean a 65% cost saving. The number of factories cannot substitute for evidence of a moat.
Shared equipment across models can spread costs. But price cuts, shifting demand or an obsolete platform can turn scale into operating leverage in reverse. Growing deliveries are only half the test. The other half is preserving returns without requiring perpetual volume acceleration.
Half a percentage point exceeds H1 operating profit
The company reported a 2.4-percentage-point year-on-year decline in H1 gross margin, citing raw-material inflation and vehicle mix. Q2 margin nevertheless rose 3.2 points sequentially to 12.6%. Improvement is real; so is exposure to external pressure.
Consider a static stress test. On RMB38.107 billion of revenue, a 0.5-percentage-point gross-margin decline removes about RMB190.5 million of gross profit, more than H1 operating profit of RMB128.5 million. This is not a loss forecast: revenue and other income-statement items are held constant, without cost responses, tax changes or management action.
A higher valuation therefore needs more than another delivery record. At comparable volumes, can engineering reuse, better yields and purchasing efficiency keep lowering the business’s break-even point?
Cash asks how much expansion consumes first
The cash-flow statement shows RMB2.170 billion of operating cash inflow, RMB1.972 billion of property, plant and equipment payments, and RMB55.1 million of intangible-asset payments. Simple subtraction leaves RMB143.9 million, consistent with the company’s approximately RMB140 million of free cash flow, versus about RMB860 million a year earlier.
That does not make every investment wasteful. New equipment can serve multiple years; one half-year cannot decide its lifetime return. Yet volume does not automatically release cash. Inventory reached RMB9.270 billion, against RMB4.548 billion at year-end. The company attributed lower operating cash flow mainly to advance stocking under its strategic plans.
Investors must check whether inventory becomes sell-through, receivables turn into cash and capital spending moderates after expansion. Without sufficient plant-utilization and maintenance-capex detail, a reliable through-cycle return cannot yet be calculated.
External supply could make factories less dependent on one brand
An August 25 CRI report described the expanded cooperation agreement signed by Leapmotor and FAW the previous day, covering vehicles and components among other areas. Stellantis’s May announcement also set out intentions for deeper purchasing, production and component collaboration.
For shareholders, the important development may not be another partner’s name. It is whether the same engineering and production assets can serve several customers. External orders that fill capacity while Leapmotor models weaken would add an operating buffer.
That is a testable path, not booked profit. Customers exposed to the same auto cycle may offer limited diversification. Customer-specific engineering, tooling, warranty obligations and payment terms can consume supplier revenue. Follow production, collections and incremental investment; do not count a design win as recognized sales.
Three frameworks ask for evidence beyond volume
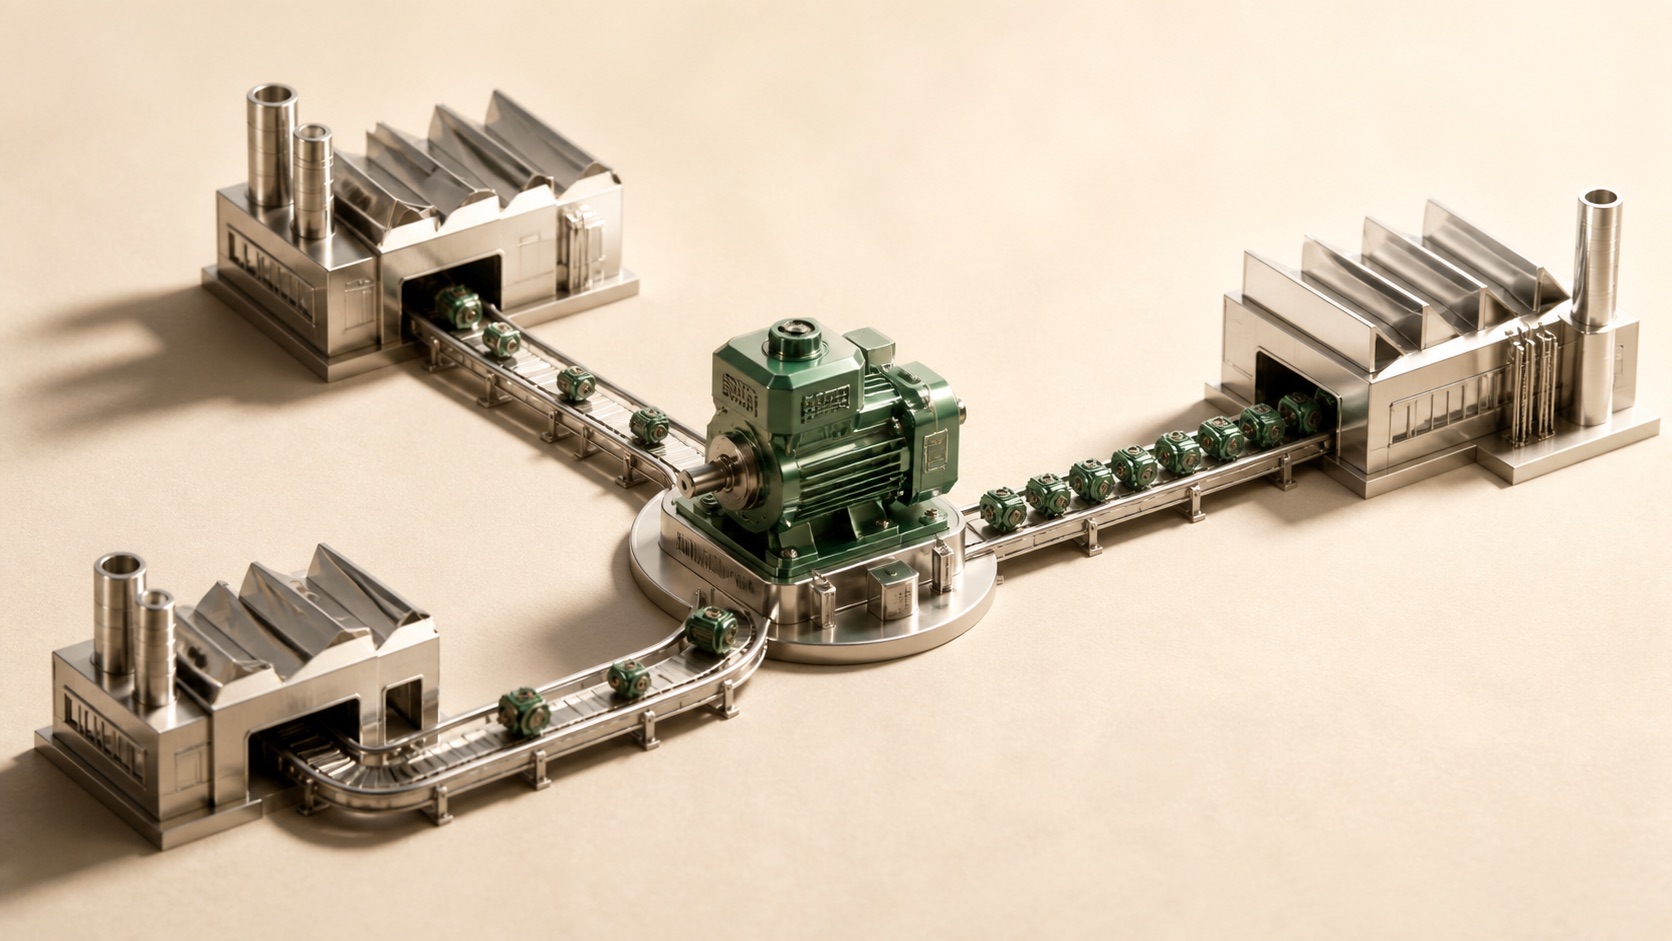
Editorial applications, not these investors’ opinions of LeapmotorManufacturing capability must pass a capital-return test
- Buffett’s owner-earnings lens: Separate expansion spending from the reinvestment needed to remain competitive. Sustainable cash, not reported profit alone, supports a long-term growth premium.
- Peter Lynch’s cyclical lens: Do not annualize the best month. Read deliveries, inventory and margins together to distinguish demand growth from channel stocking.
- Munger’s inversion: Assume insourcing fails. Is idle capacity, technological change or organizational complexity responsible? Test whether platform reuse and outside customers actually reduce those risks.
Replace the sales leaderboard with a return scorecard
The strongest bull evidence would be the same capital supporting more models and customers, with margin recovery leaving more cash behind. The strongest bear evidence would be inventory and capex rising while competition continually takes away efficiency gains. Neither follows automatically from owning 18 factories.
Model vehicle operations, incremental external supply and necessary reinvestment separately. Then use a reverse DCF to test the long-term returns required by the price. Do not automatically add plant resale value to going-concern cash flows or assign all partner economics to Leapmotor.
Combine a capacity-cycle analysis with an investment risk checklist. When deliveries stop setting records, will those 18 factories generate cash for shareholders, or require shareholders to keep feeding them?
Recent posts








































Frequently asked questions
Do Leapmotor’s 18 factories prove a cost moat?
They demonstrate in-house capabilities, but excess returns require evidence on through-cycle utilization, total costs, capital spending and cash generation. Factory count and self-production rates are insufficient.
What was Leapmotor’s H1 2026 operating cash flow?
The HKEX filing reports RMB2.170463 billion, rounded to RMB2.17 billion in the summary. Free cash flow was approximately RMB140 million. These are different measures.
Would a half-point margin decline make Leapmotor loss-making?
The article presents a static sensitivity: 0.5 percentage points on H1 revenue equals about RMB190.5 million of gross profit, above RMB128.5 million of operating profit. It is not a forecast and does not simulate volume, cost responses, tax or other changes.
Can external supply agreements immediately enter valuation?
Distinguish agreements, design wins, production, revenue recognition and cash collection. Model only reasonably supportable future cash flows, net of development, tooling, warranty and working-capital needs.
Turn delivery headlines into investment hypotheses with Valuefocus: organize original filings, separate margins, inventory and reinvestment, then use investor frameworks and valuation tools to examine how much cash growth leaves for shareholders.
Download Valuefocus