Which value investors beat the S&P 500?
Compare the long-term track records of legendary value investors against the S&P 500 — using publicly reported 10-year returns from GuruFocus.

Do value investors beat the S&P 500?
Over the last decade, only a minority of professional value investors have beaten the S&P 500 on reported returns. A handful of concentrated, fundamentals-driven managers have compounded ahead of the index, while many have trailed it — which is exactly why low-cost index funds are a sensible default for most people.
- The S&P 500 returned roughly 12–13% annualized over the last 10 years with dividends reinvested.
- Beating that consistently over a full decade is rare, even for famous investors.
- Outperformance tends to come from concentration and discipline, not from trading more.
Beating the market over a decade is rare — even among professionals. This page lines up the reported 10-year returns of the value investors we track against a roughly 12–13% annualized return for the S&P 500 (with dividends reinvested) over a comparable period.
The comparison is directional, not exact: managers report on different schedules, returns are self-reported, and a 13F portfolio is not the same as a fund’s net-of-fee result. Use it to see who has genuinely compounded ahead of a simple index — and who has not.
Reported 10-year return vs the index
S&P 500 (10Y annualized, est.): ~+12.5%
| # | Investor / Fund | 10Y Return | vs S&P 500 |
|---|---|---|---|
| 1 |  Ron Baron | +24% | Beat the index (+11.5%) |
| 2 |  David Tepper | +20.1% | Beat the index (+7.6%) |
| 3 |  PRIMECAP Management | +15.2% | Beat the index (+2.7%) |
| 4 | 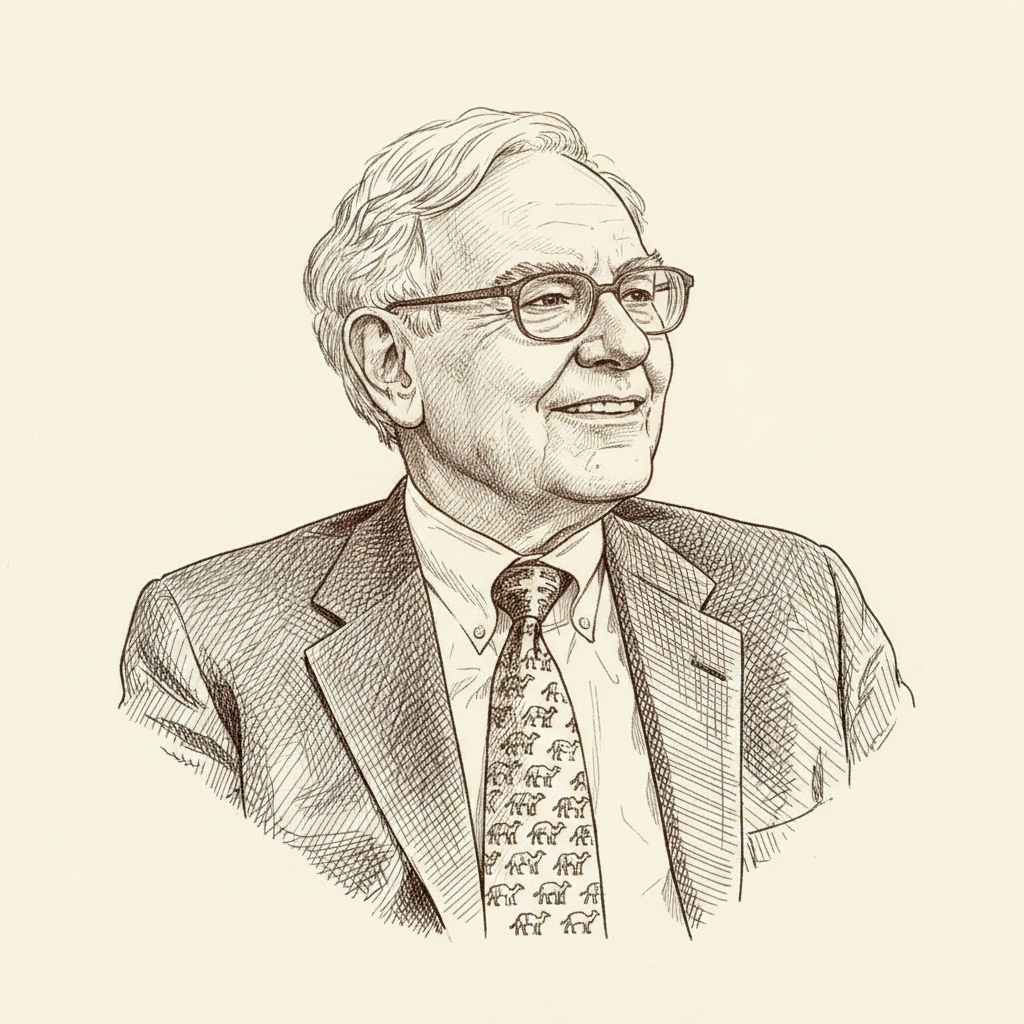 Warren Buffett | +14.3% | Beat the index (+1.8%) |
| 5 | 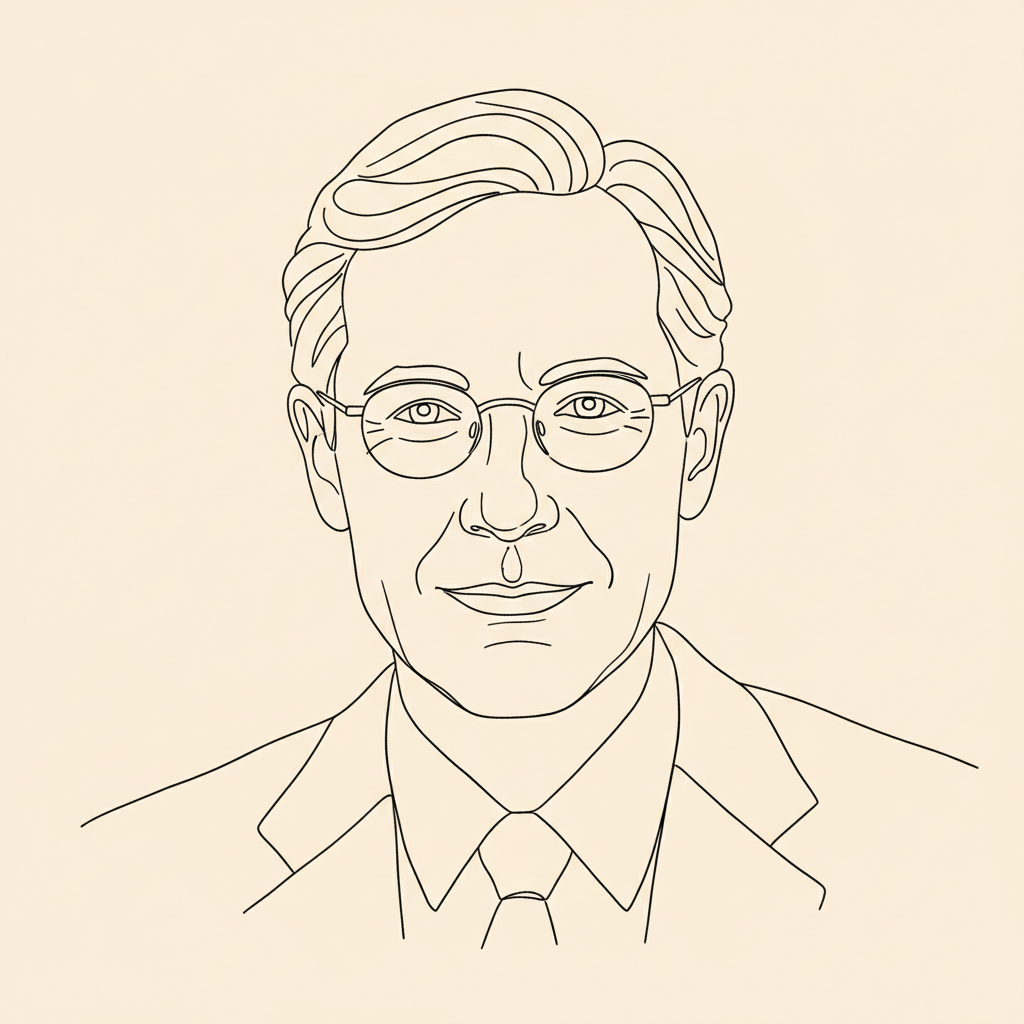 Bill Nygren | +13.7% | Beat the index (+1.2%) |
| 6 | 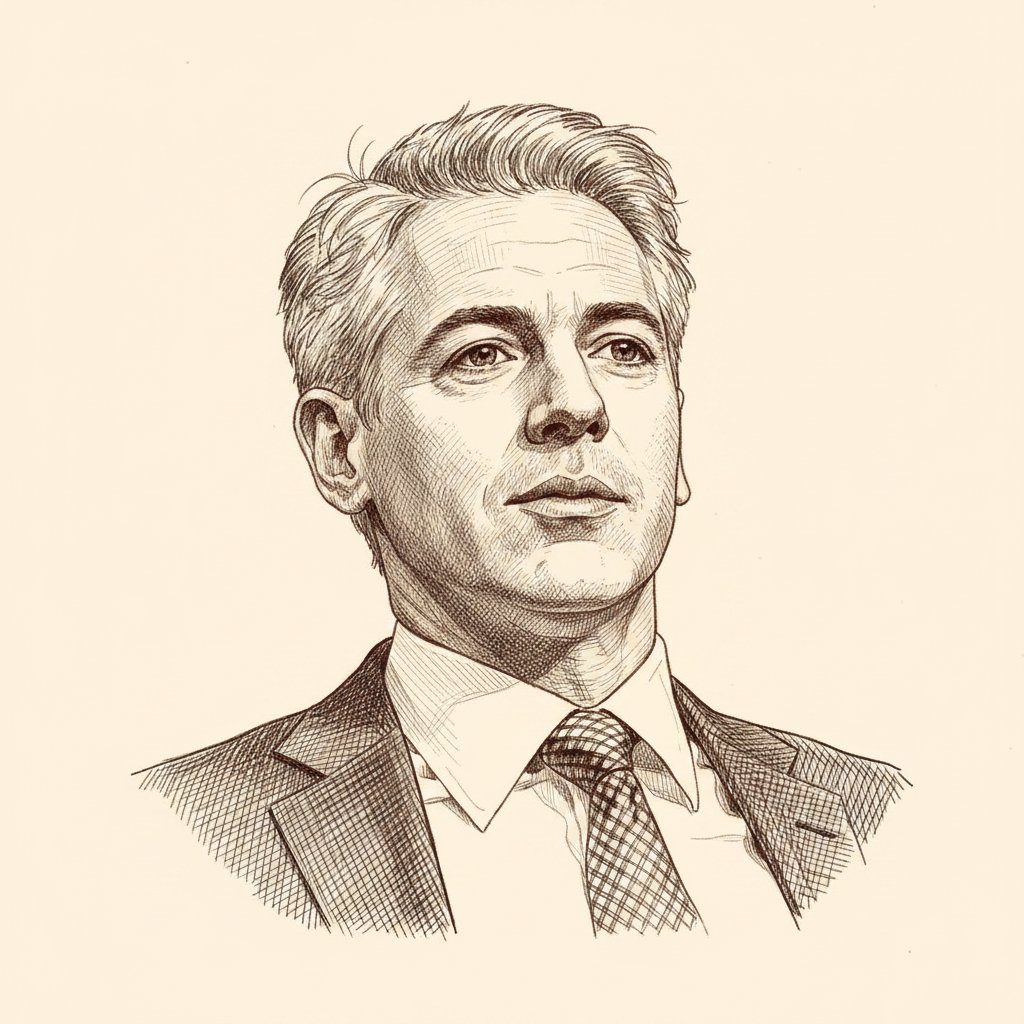 Bill Ackman | +13.3% | Beat the index (+0.8%) |
| 7 | 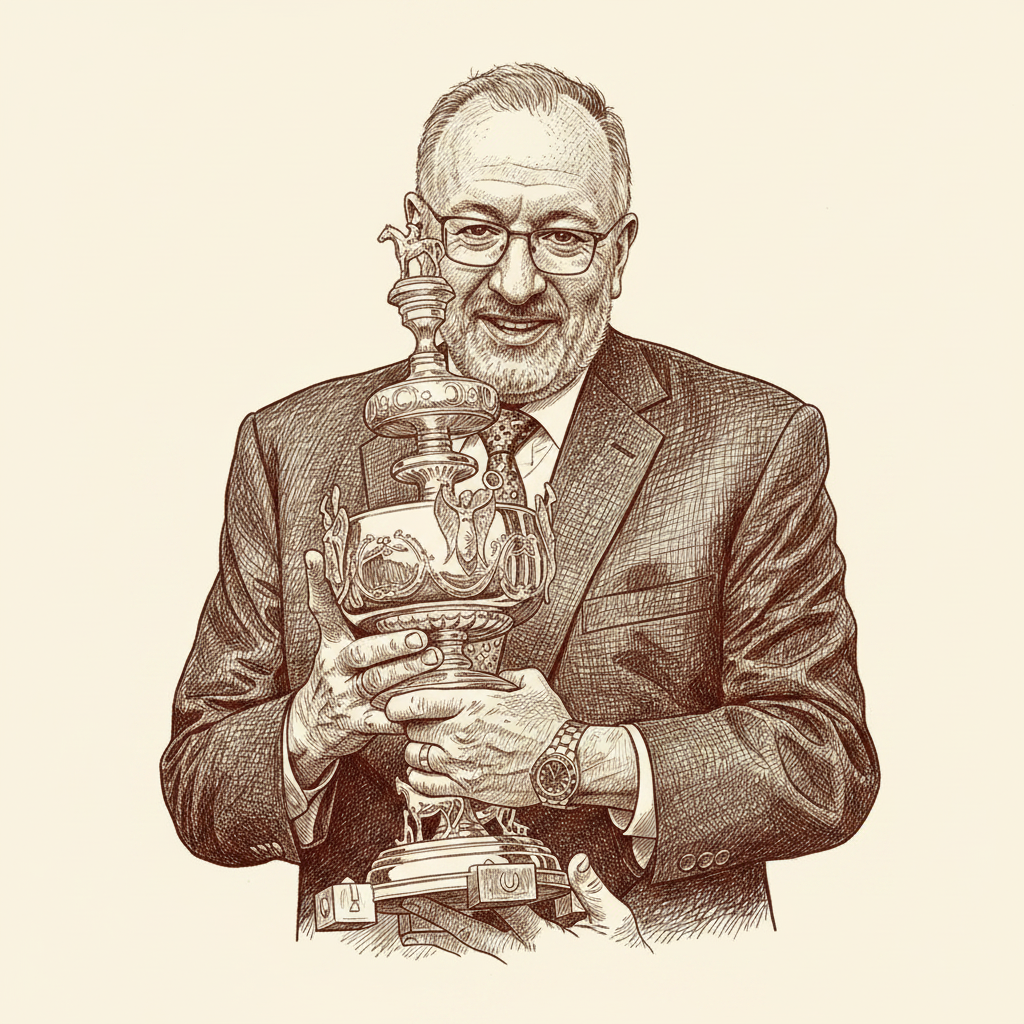 Seth Klarman | +12.8% | Beat the index (+0.3%) |
| 8 |  Dodge & Cox | +12.8% | Beat the index (+0.3%) |
| 9 |  Chris Davis | +12.8% | Beat the index (+0.3%) |
| 10 |  Prem Watsa | +12.6% | Beat the index (+0.1%) |
| 11 |  First Eagle Investment | +12.1% | Trailed the index (-0.4%) |
| 12 |  Yacktman Asset Management | +11.4% | Trailed the index (-1.1%) |
| 13 |  Ruane Cunniff | +11% | Trailed the index (-1.5%) |
| 14 |  Mario Gabelli | +9.6% | Trailed the index (-2.9%) |
| 15 |  John Rogers | +9.5% | Trailed the index (-3.0%) |
| 16 |  Tom Russo | +9.2% | Trailed the index (-3.3%) |
| 17 |  Bruce Berkowitz | +8.9% | Trailed the index (-3.6%) |
| 18 |  Joel Greenblatt | +8.9% | Trailed the index (-3.6%) |
| 19 |  Daniel Loeb | +7.9% | Trailed the index (-4.6%) |
| 20 |  Wallace Weitz | +7.7% | Trailed the index (-4.8%) |
| 21 |  Mason Hawkins | +6.7% | Trailed the index (-5.8%) |
| 22 |  Jeremy Grantham | +6.6% | Trailed the index (-5.9%) |
| 23 |  Tom Gayner | +6% | Trailed the index (-6.5%) |
| 24 |  Francis Chou | +6% | Trailed the index (-6.5%) |
| 25 |  Ken Fisher | +4% | Trailed the index (-8.5%) |
| 26 |  David Einhorn | +3.9% | Trailed the index (-8.6%) |
| 27 |  George Soros | 0% | Trailed the index (-12.5%) |
| 28 |  Mohnish Pabrai | 0% | Trailed the index (-12.5%) |
| 29 |  Carl Icahn | 0% | Trailed the index (-12.5%) |
| 30 |  Stanley Druckenmiller | 0% | Trailed the index (-12.5%) |
| 31 |  Howard Marks | 0% | Trailed the index (-12.5%) |
| 32 |  Leon Cooperman | 0% | Trailed the index (-12.5%) |
| 33 |  Ray Dalio | 0% | Trailed the index (-12.5%) |
Source: GuruFocus reported 10-year returns; S&P 500 benchmark is an approximate total-return figure for illustration.

The $25 million lesson that changed Buffett
In 1972 the sellers of See's Candies asked $30 million; Buffett, trained on Graham's cigar butts, refused to go above $25 million — roughly three times book value, a price the old Buffett would never pay. The deal nearly died over $5 million. Charlie Munger pushed back: a beloved brand with loyal customers and genuine pricing power deserved a premium.
They paid the $25 million. See's went on to ship more than $1.65 billion of cumulative pre-tax earnings back to Omaha while needing almost no additional capital — raising prices every year without losing a single loyal customer. Buffett later called it 'the prototype of a dream business' and credits this one purchase with rewiring how he invests.
Quality compounds quietly for decades. Temperament and a clear circle of competence beat chasing the cheapest price.

The only deal Munger ever pushed
In the depths of the 2008 crisis, Munger did something he had never done before: he actively lobbied Buffett to invest in BYD, a Chinese battery and car maker led by engineer Wang Chuanfu — a man Munger described as "a combination of Thomas Edison and Jack Welch". The conviction came through Li Lu, whose circle of competence covered what Omaha's did not.
Berkshire paid $232 million for about 10% of the company — a tiny position by its standards, in an industry Buffett had publicly sworn off. At its 2022 peak the stake was worth roughly $9 billion, close to a forty-fold gain, before Berkshire began trimming.
A circle of competence can be extended honestly — by trusting someone who genuinely has one where you do not.
Related tools
Frequently asked questions
What S&P 500 return are you comparing against?
We use an approximate 12–13% annualized total return (dividends reinvested) for the S&P 500 over the last ten years. It is a round benchmark for illustration, not a precise figure for any exact date range.
Why do some investors trail the index?
Beating the market over a full decade is genuinely hard. Fees, cash drag, conservative positioning, and simple bad luck all weigh on returns — which is why index funds are a reasonable default for most investors.
Is reported return the same as fund performance?
Not exactly. GuruFocus figures are delayed and self-reported, and a 13F equity portfolio differs from a fund’s actual net-of-fee result. Treat the comparison as directional.
Learn how the market-beaters actually pick stocks — inside Valuefocus.
Download Valuefocus