Value Masters Annual Returns Heatmap
Every year, every master, color-coded. A green-to-red grid of reported annual returns that shows at a glance who compounds steadily through bull and bear markets — and who swings wildly.
What does an annual-returns heatmap reveal about an investor?
A returns heatmap plots each investor’s yearly performance as a colored grid, so you can read consistency at a glance instead of relying on a single headline number. Steady green rows reveal managers who compound through cycles; rows that alternate deep green and red reveal high-variance strategies that depend on timing. It reframes "what was the return?" into the more useful question, "how reliably was it earned?"
- Each cell is one manager’s reported return for one calendar year.
- Green is a gain, red is a loss; deeper color means a bigger move.
- Steady green rows signal cycle-tested consistency; alternating colors signal high variance.
A single year of strong returns proves little; consistency across a full market cycle is what separates durable strategies from lucky ones. This heatmap lays out the reported annual return for every value investor we track, one column per year, so the pattern is impossible to miss.
Deep green marks a great year, red marks a loss, and pale cells sit near flat. Rows are sorted by average return over the window. Click any name to open that manager’s full profile and strategy.
| Manager | '14 | '15 | '16 | '17 | '18 | '19 | '20 | '21 | '22 | '23 | '24 | '25 | Avg |
|---|---|---|---|---|---|---|---|---|---|---|---|---|---|
| Ron BaronBaron Funds | +10 | -3 | +4 | +32 | -2 | +45 | +149 | +31 | -43 | +43 | +33 | +25 | +27 |
| Bill AckmanPershing Square Capital Management, L.P. | +37 | -16 | -10 | -2 | -1 | +44 | +57 | +23 | -8 | +21 | +8 | +18 | +14 |
| Warren BuffettBerkshire Hathaway Inc | +27 | -12 | +23 | +22 | +3 | +11 | +2 | +30 | +4 | +16 | +26 | +11 | +13 |
| Prem WatsaFairfax Financial Holdings | +20 | +5 | -6 | +25 | -1 | +15 | +1 | +34 | +6 | +25 | +15 | +21 | +13 |
| Bill NygrenOakmark Fund | +12 | -4 | +18 | +21 | -13 | +27 | +13 | +34 | -13 | +31 | +16 | +14 | +13 |
| Chris DavisDavis Selected Advisers | +13 | +2 | +15 | +19 | -12 | +26 | -6 | +31 | -9 | +16 | +30 | +29 | +13 |
| John RogersAriel Investment, LLC | +11 | -4 | +16 | +16 | -14 | +25 | +10 | +30 | -19 | +16 | +12 | +14 | +9 |
| Bruce BerkowitzFairholme Capital Management | -3 | -11 | +26 | -6 | -23 | +32 | +47 | +7 | -20 | +47 | -17 | +29 | +9 |
| Mario GabelliGAMCO Investors | +5 | -6 | +12 | +20 | -8 | +22 | +11 | +19 | -11 | +10 | +8 | +17 | +8 |
| Daniel LoebThird Point, LLC | +6 | -1 | +6 | +18 | -11 | +17 | +21 | +23 | -22 | +4 | +26 | +9 | +8 |
| Joel GreenblattGotham Asset Management, LLC | +9 | -10 | +8 | +10 | -5 | +12 | -6 | +27 | -5 | +18 | +21 | +16 | +8 |
| Wallace WeitzWeitz Investment Management Inc | +8 | -9 | +6 | +12 | -11 | +34 | +8 | +24 | -21 | +18 | +16 | +3 | +7 |
| Francis ChouChou Associates Management | +12 | -7 | -3 | +4 | -8 | +1 | -9 | +52 | +9 | +1 | +22 | +3 | +6 |
| Tom RussoGardner Russo & Quinn LLC | +6 | – | – | – | – | – | – | – | – | – | – | – | +6 |
| Mason HawkinsSoutheastern Asset Management | +5 | -19 | +21 | +16 | -18 | +15 | +11 | +24 | -23 | +24 | +9 | +3 | +6 |
| Ken FisherFisher Asset Management, LLC | +5 | +2 | – | – | – | – | – | – | – | – | – | – | +3 |
| David EinhornGreenlight Capital | +9 | -20 | +7 | +2 | -30 | +9 | +1 | +8 | +25 | +9 | +10 | +8 | +3 |
| David TepperAppaloosa LP | +2 | – | – | – | – | – | – | – | – | – | – | – | +2 |
| Seth KlarmanThe Baupost Group | – | – | – | – | – | – | – | – | – | – | – | – | – |
| Jeremy GranthamGMO LLC | – | – | – | – | – | – | – | – | – | – | – | – | – |
| Carl IcahnIcahn Capital Management LP | – | – | – | – | – | – | – | – | – | – | – | – | – |
| Tom GaynerMarkel Gayner Asset Management Corp | – | – | – | – | – | – | – | – | – | – | – | – | – |
Source: GuruFocus reported annual returns. Delayed and self-reported; not net-of-fee fund results.

The $25 million lesson that changed Buffett
In 1972 the sellers of See's Candies asked $30 million; Buffett, trained on Graham's cigar butts, refused to go above $25 million — roughly three times book value, a price the old Buffett would never pay. The deal nearly died over $5 million. Charlie Munger pushed back: a beloved brand with loyal customers and genuine pricing power deserved a premium.
They paid the $25 million. See's went on to ship more than $1.65 billion of cumulative pre-tax earnings back to Omaha while needing almost no additional capital — raising prices every year without losing a single loyal customer. Buffett later called it 'the prototype of a dream business' and credits this one purchase with rewiring how he invests.
Quality compounds quietly for decades. Temperament and a clear circle of competence beat chasing the cheapest price.
The only deal Munger ever pushed
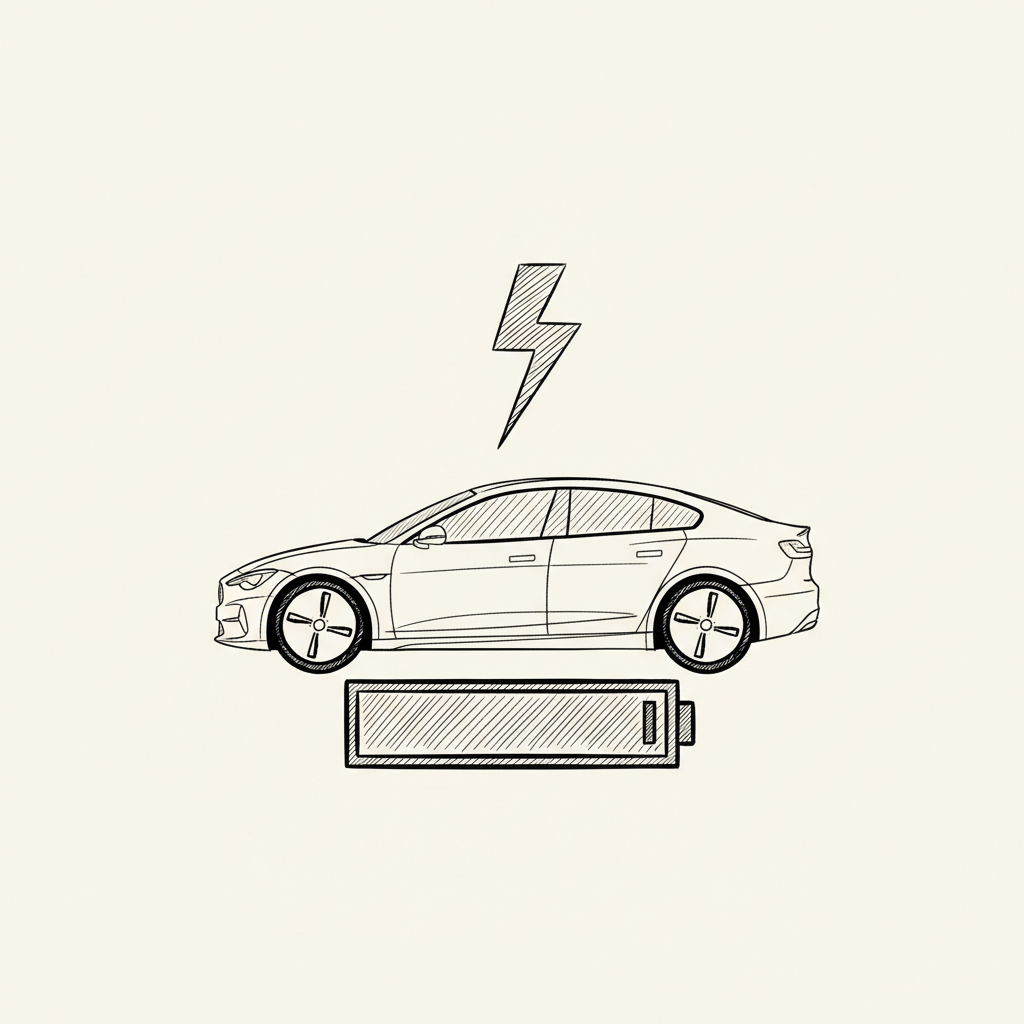
In the depths of the 2008 crisis, Munger did something he had never done before: he actively lobbied Buffett to invest in BYD, a Chinese battery and car maker led by engineer Wang Chuanfu — a man Munger described as "a combination of Thomas Edison and Jack Welch". The conviction came through Li Lu, whose circle of competence covered what Omaha's did not.
Berkshire paid $232 million for about 10% of the company — a tiny position by its standards, in an industry Buffett had publicly sworn off. At its 2022 peak the stake was worth roughly $9 billion, close to a forty-fold gain, before Berkshire began trimming.
A circle of competence can be extended honestly — by trusting someone who genuinely has one where you do not.
Related tools
Frequently asked questions
Why sort by average return instead of a single year?
A single year rewards luck and timing. Averaging across the full window favors managers who stayed in the game and compounded — which is the trait long-term investors actually care about. You can still read each year column to see how that average was earned.
Are these returns net of fees?
No. These are GuruFocus’s reported annual returns, which are delayed and self-reported and may not reflect fees, so treat them as directional rather than precise audited fund results.
Why do some cells look pale or empty?
Pale cells are years near break-even. Empty cells mean no reported return for that manager in that year — often because their track record on record starts later than the earliest column.
Study how the masters compound through cycles — then value any stock inside Valuefocus.
Download Valuefocus