
Value Stock Screener
Enter or paste your own stock metrics and filter them against value-investing thresholds you set. Everything runs locally in your browser — this is a research starting point, not live data or investment advice.
Not financial advice. This calculator is for research and educational purposes only. Outputs are estimates based on the inputs you provide and are not buy or sell recommendations. Always do your own research and consult a licensed professional before making investment decisions.
Default thresholds are a common starting point, not a recommendation. Leave a field blank to disable that filter.
Up to 10 stocks. All filtering happens locally in your browser.
One stock per line: ticker, P/E, P/B, Debt/Equity, ROIC, Rev growth, FCF margin (commas or tabs). Market cap and notes optional.
Add a stock or paste a table to start screening.
Stress-test the result
Change one assumption at a time. The bars show direction, not a forecast.
What it is

A value stock screener narrows a long list of companies down to a shorter list of candidates that meet the criteria you care about — low valuation, manageable debt, solid returns on capital, and healthy cash generation. This tool is a manual, data-ready screener: you enter or paste the metrics yourself, set your own thresholds, and it filters locally in your browser. No live data is fetched and no real stock figures are pre-loaded. The tickers you type are just labels.
Who it is for
- Value investors building a watchlist from metrics they have already gathered.
- Anyone learning which fundamental thresholds separate cheap-and-strong from cheap-and-risky.
- Students and analysts practicing a repeatable, criteria-based screening process.
Inputs and outputs
Inputs
- Ticker / label
- A name for each row. You can use a real ticker — it is treated only as a label.
- P/E, P/B
- Valuation multiples you enter for each stock.
- Debt / Equity
- Balance-sheet leverage; higher means more financial risk.
- ROIC, Rev growth, FCF margin
- Quality and growth metrics, entered as percentages.
- Filter thresholds
- The max/min limits each stock must meet to pass.
Outputs
- Passing candidates
- Stocks that meet every active filter, sorted by how comfortably they pass.
- Failed filters
- For each stock, the specific filters it missed and by how much.
- Metric profile
- A pass / fail / missing flag for every stock on every metric.
Example workflow
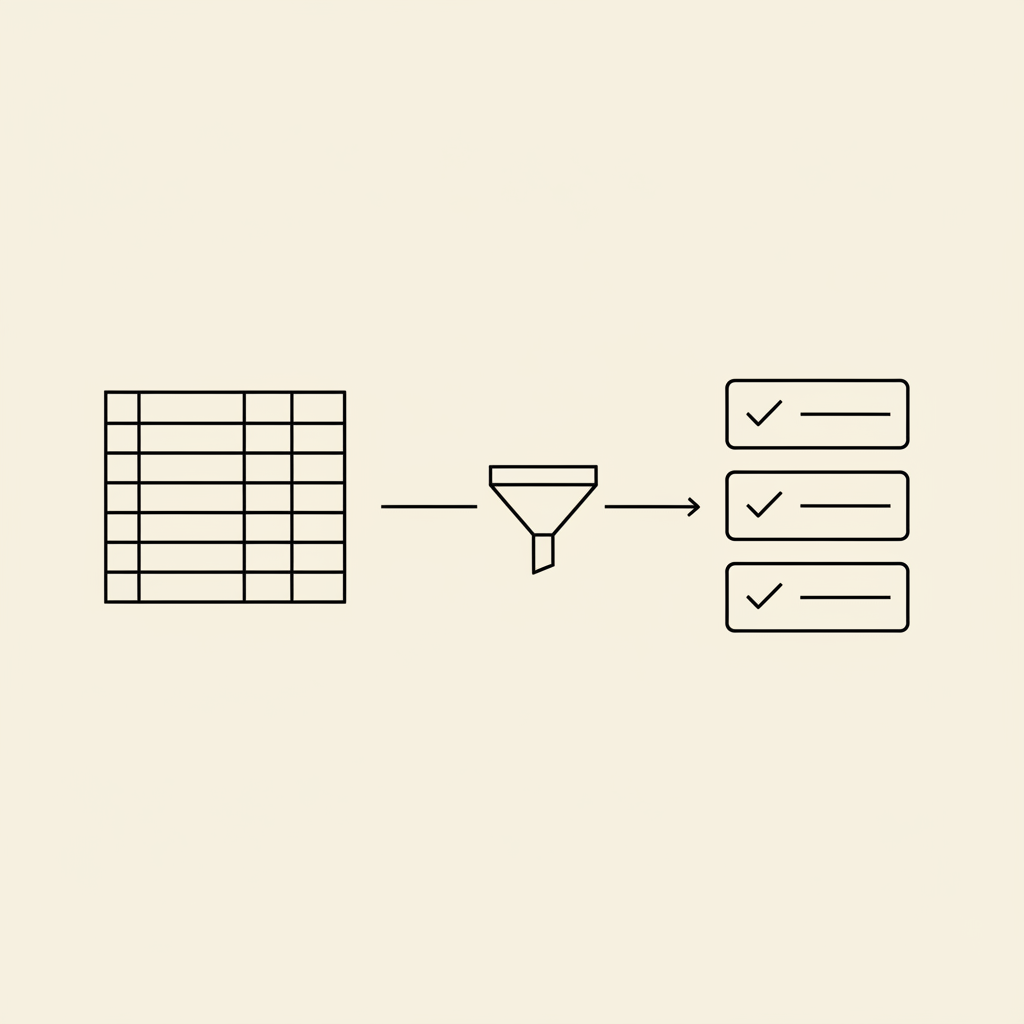
- Add a few stocks, or paste a table of metrics you gathered yourself.
- Set thresholds — for example Max P/E 15, Max D/E 1.0, Min ROIC 10%, Min FCF margin 5%.
- Read the passing candidates list and check why each other stock failed.
- Use the metric profile to see exactly which criteria each stock met or missed.
- Treat the survivors as a research shortlist — the start of your work, not the end.
Change a threshold and the candidate list shifts immediately. The screener organizes the numbers you entered; it does not judge whether a stock is a good investment.
Common mistakes

- Treating a passing screen as a buy decision instead of a research starting point.
- Entering stale or inconsistent figures, so the screen filters on bad data.
- Setting thresholds so strict that every good company is filtered out.
- Ignoring stocks marked "incomplete" — a missing metric is not the same as a fail.
- Comparing companies from very different industries on the same fixed thresholds.

Buying a dollar for fifty cents — by the basket
Graham's signature operation was mechanical and unglamorous: buy companies trading below their "net-net" working capital — cash, receivables and inventory minus every liability — so the buyer effectively paid nothing for the factories, the brand or the future. Each one was a discarded cigar butt with one free puff left.
Any single net-net could disappoint, so Graham never relied on one: Graham-Newman held dozens at a time, selling each as it returned to fair value. Across three decades, through depression aftermath and war, the diversified baskets earned roughly 20% a year — built from stocks nobody else wanted.
A screen's edge comes from discipline and diversification across the basket — not from any single thrilling pick.

Buying everything under a dollar as the world went to war
In 1939, as war broke out in Europe and pessimism was total, young John Templeton borrowed $10,000 and placed one order: 100 shares of every NYSE and AMEX stock trading below $1 — 104 companies, 34 of them already in bankruptcy proceedings. He picked nothing; he priced despair across an entire basket.
He held for about four years and roughly quadrupled the money. Only four of the 104 positions went to zero. The systematic rule — maximum pessimism, wide diversification, a fixed holding period — did the work that stock-picking brilliance could not.
At the point of maximum pessimism, breadth and a written rule beat selectivity and nerve.

The exception that beat all the rules
In 1948, Graham-Newman put about $712,000 — close to a quarter of the fund — into GEICO, an insurer that sold directly to careful drivers by mail and skipped the agent entirely. The position broke Graham's own diversification rules, and regulators even forced the fund to distribute the shares to its investors.
Those who kept the shares watched them grow more than two hundred-fold. Graham, the great apostle of wide diversification and statistical bargains, admitted in his memoirs that this single decision earned more than all the profits from twenty years of his diversified operations combined.
Even the father of quantitative bargains conceded: one outstanding business, deeply understood, can outweigh a career of small edges.
Related tools
Frequently asked questions
Does this screener use live market data?
No. You enter or paste all the metrics yourself, and the filtering runs locally in your browser. No data is fetched from any API and no real stock figures are pre-loaded.
What do the pass and fail flags mean?
They show only whether a stock met or missed the thresholds you set for each metric. They are not investment ratings and never imply a buy, sell, or hold decision.
How do I paste a list of stocks?
Put one stock per line as ticker, P/E, P/B, Debt/Equity, ROIC, revenue growth, FCF margin, separated by commas or tabs. Market cap and notes are optional. Press Parse to load them into the table.
What happens if I leave a metric blank?
A blank metric is marked as missing rather than a fail. Stocks with missing data on an active filter are listed separately under "Needs more data".
Will this be connected to real data later?
The tool is built data-ready so it can later be upgraded to pull metrics from a source like EODHD or GuruFocus. Until then it is fully manual and shows only the numbers you enter.
Want to screen and research stocks in one app?
Download Valuefocus